Analysis are ONLY for quick trades and NOT long term investments. Always define risk, allocate accordingly and understand the game you're playing! (eg: a chart dated for today is intended to be played for tomorrow and possibly the following day).
January 19, 2017
|
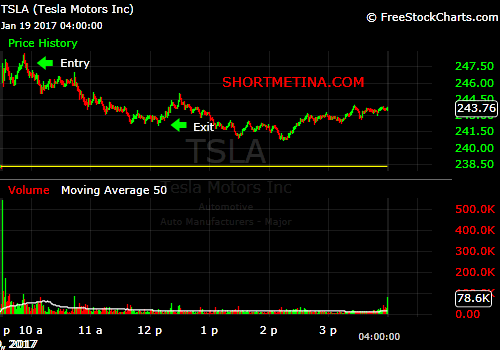
Went short when the stock had a hard time penetrating and staying above pre-market high of 248.66.
Short avg around 247. Covered short around 242. +5 points. Looking for the gap of 238.68 to get filled at some point. We came close today with a low of 240.75 before we got that bounce. 245 is a key level for me tomorrow. No current positions. I have every intentions on taking a position providing an opportunity presents itself. Don't forget to sign-up for our free newsletter. |
|
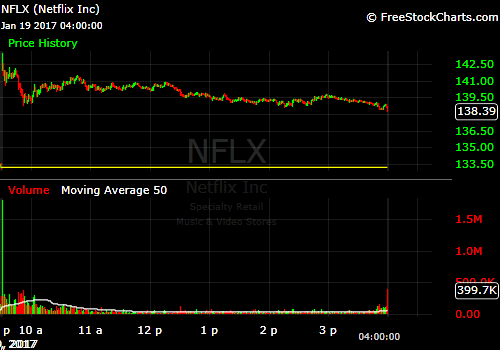
If we just look at trading action today; the trend sticks out like a sore thumb. Trading in any other direction but that of the trend is what? You guessed it; it's fighting the trend.
Currently in this trade; will detail it when I am out but key levels I am paying attention to is 138-140. Mainly 139 ish. That seemed like a real battleground level today. Trade wisely. Don't forget to sign-up for our free newsletter. |
October 6, 2016
$TWTR
October 5, 2016
$YUM
October 3, 2016
$TWTR, $DB, $NFLX
|
|
|
September 28, 2016
$TWTR, $NKE, $WFC
September 27, 2016
$TWTR
September 22, 2016
$AVXL
September 21, 2016
$WFC, $NVAX
|
|
|
September 20, 2016
$AIRG, $AEGR, $BSPM
|
|
|
|
September 19, 2016
$TECD
September 16, 2016
$BMY
September 15, 2016
$AERI, $NETE, $TKAI
|
|
|
|
September 14, 2016
$ACST, $BSPM
|
|
|
September 8, 2016
$BCEI, $GTXI
|
|
|
September 6th and 7th, 2016
$CMG, $CGNT, $RTRX
|
|
|
|
September 1, 2016
$LULU
|
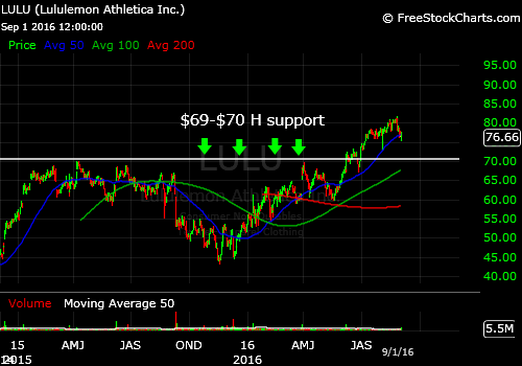
Stock shed 9% or so after hours. I suspect we will continue the sell-off tomorrow. I expect an early morning run up then a drop.
After hour close at Horizontal support=$69-$70. How would I play this? Wait for it to get as close to $74 as possible and then short (waiting for the appropriate signal and confirmation). I will be making commentary on this stock tomorrow on both my Twitter (@marketdeclassd) and Stocktwits (@shortmetina) account. Happy Trading! |
August 17, 2016
$HAIN
|
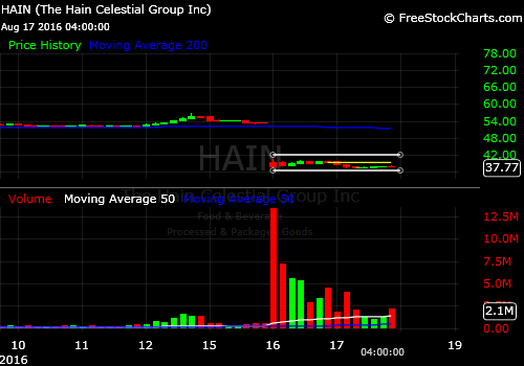
In my private twitter feed, this stock has been played 3 ways. Continue reading.
Day 1: 8/16/'16 Short around $40. Closed short around high $37. (+2.5 points). Day 2: 8/17/'16 Short around $39.70. Close short around low $37 (+2 points). Long around low $37 (using $37.25 as risk). Day 3: 8/18/'16 (tomorrow's game plan) Hold long position using $37.25 as risk. Tgt= $39/$40. Stop out around $36. Make sure general market conditions supports a long thesis. Also, understand the idea of risk vs reward. Day 4: 8/19/2016- Follow-up Yesterday proved to be a decent day, average of (+1-1.5 points); if you didn't chase and paid attention to my point of entry (which showed support). Overall, neutral to bearish today. Levels to pay attention to is yesterday's HOD ($38.66) and $39.30-50 (which is 2nd level of resistance). If it's having a hard time penetrating any of those levels; may see further downside. I just can't make a bullish case for this stock right now (based on this week's trading activity). All and all, 4.5-6 points on this play. |
August 8, 2016
$ISNS
|
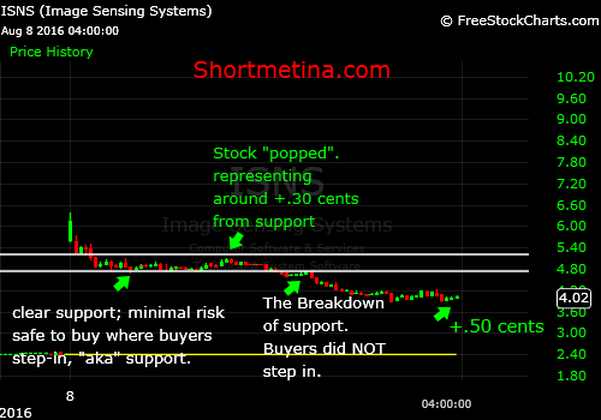
What you should look out for is “patterns” in the markets; within a stock, etc.. Out of the handful of stocks that I’ve analyzed on my “charts of the week”; most have been explosive in the first 5 minutes of trading and then they fade for the remainder of the day. $ISNS is no different.
Exploded during open and faded. In my private twitter feed I said; possible trades were
Both trades would have worked. Look at illustration for what I mean. This is just a "still" chart. Don't get caught out there alone, "real time requires real time calls". Come and join our head trader. Educated in the field of Psychology with over a decade of trading experience. Best chart reader bar none! |
August 5th, 2016
$SINO
|
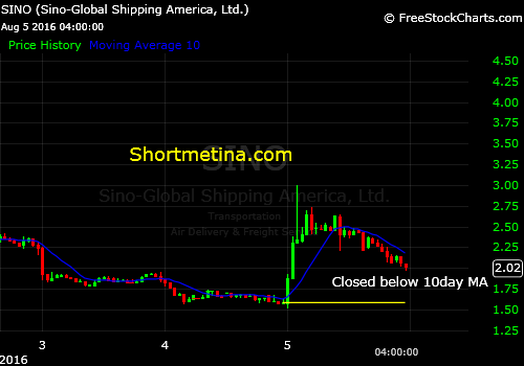
Unlike the other runners this week, this kept going for 30 minutes before selling off.
At any rate, a sustained move above $2.15 (or 10 day moving avg) is bullish . Resistance 2: $2.27, and then Resistance 3: $2.40 Support 1: $1.89 Support 2: $1.95 Pay attention to volume around those key areas. That should tell you; your best case scenario. Remember to define stops and allocate accordingly. This is just a "still" chart. Don't get caught out there alone, "real time requires real time calls". Come and join our head trader. Educated in the field of Psychology with over a decade of trading experience. Best chart reader bar none! |
August 4th, 2016
$CHEK
|
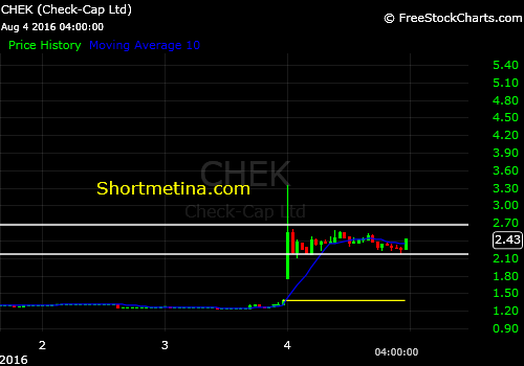
Buy, Short or Hold?
....stock is range bound. Exploded the first 3 minutes of trading, then spent the day trading within a range. $2.55-$2.16. Stock closed close to the "upper end" of range. If I played this as a short; I would wait for it to get as close to $2.55 (possibly some over) and short it. Covering around $2.16 (+.40/per share). If I wanted to long; I would buy as close to support ($2.16) as possible and selling around resistance ($2.55). Remember to define stops and allocate accordingly. This is just a "still" chart. Don't get caught out there alone, "real time requires real time calls". Come and join our head trader. Educated in the field of Psychology with over a decade of trading experience. Best chart reader bar none! |
August 3rd, 2016
$MPET
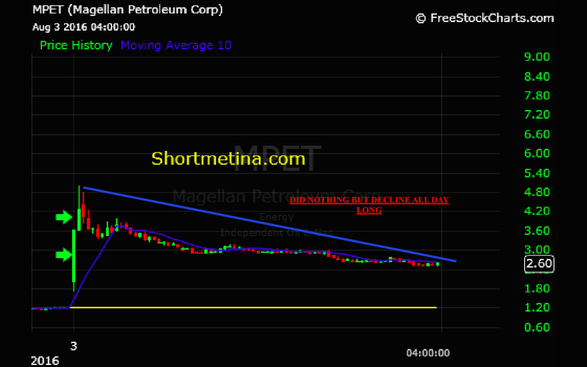
Buy, Short, Hold?
Short! (What is shorting?)
Stock exploded in the first few minutes of trading (long green candles) but faded for the remainder of the day. Volume weened off as well. Based on volume alone; there is no interest.
How I would play this?
Short if stock opens below today's close, for a quick wash.
Paying attention to first level of support ($2.45). If it cracks that, the fall is steep. Next support isn't until $2.
If it pops on the open and I see a green candle. I am looking at resistance levels.
1st. $2.65 and 2nd $3.00.
Don't get caught out there alone, "real time requires real time calls". Come and join our head trader.
Educated in the field of Psychology with over a decade of trading experience. Best chart reader bar none!
August 2nd, 2016
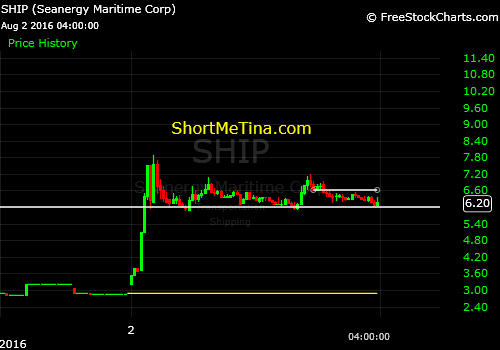
$SHIP
|
Members of our private twitter feed were alerted to buy $SHIP at $6.35 and we saw a spike to $7.17 in less than 30 mins.
Are we going to Buy, sell or hold? Long? Two possible long scenarios: 1. $5.80-$6. Is the safest buy level based on chart 2.Break out level would be a sustatined move about $6.30 Short? Two possible short scenarios: 1.I would play this two ways? If it opens lower than today’s close; I would go short. 2. I would short break out area of $6.50-$6.60 Keep your stops tight. |
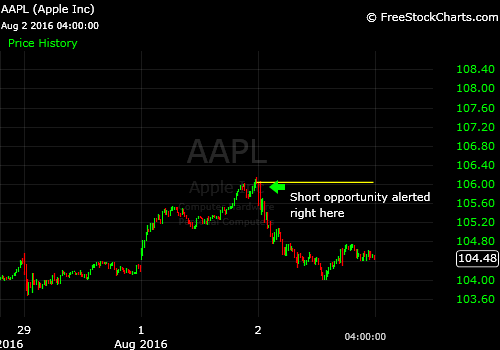
$AAPL
|
Members in our private twitter feed were alerted:
Apple Short: 105.70-106 Low of day: $104 |
Want more? Sign-up for our premium service today.
July 29th, 2016
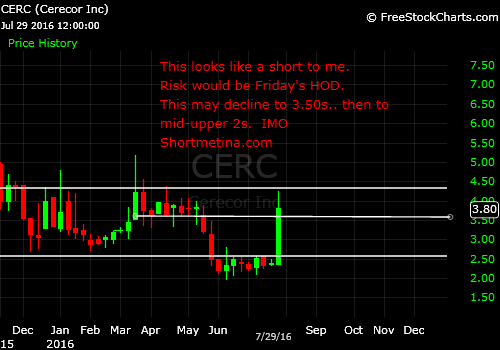
$CERC
|
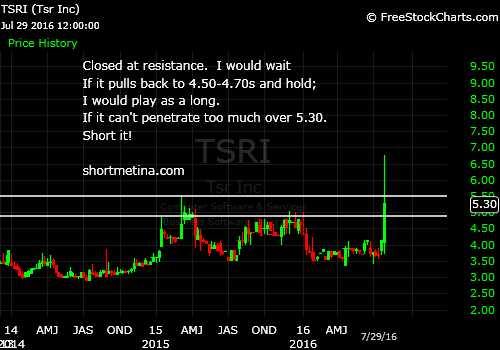
$TSRI
|
Long or Short?
Not sure. Look at the chart. Sometimes in the market; we have to learn to react; less predicting. |
Subscribe to our free mailing list

|
Popular Blogs


|


|


|