ShortMeTina- Stock Trading Website for Swing Traders and Day Traders
  • HOME
  • TRADING COURSE

TRX/BTC- Price Analysis 1.4.18

1/4/2018

1 Comment


TRX/BTC

Picture
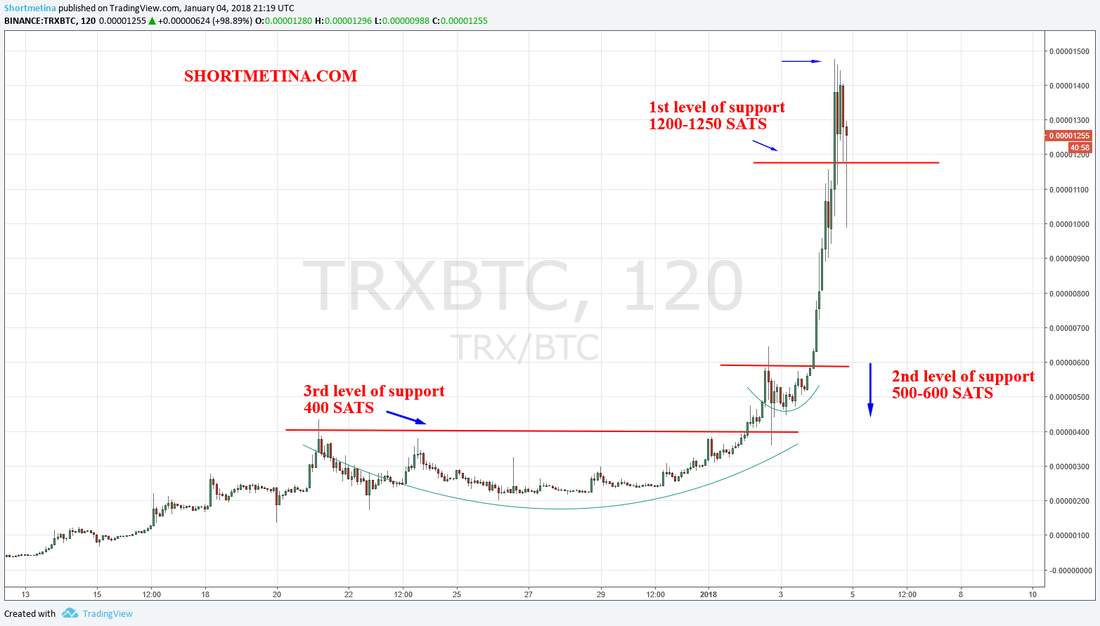
(click to enlarge image)
TRX has been on a tear for the past two weeks.  In particular, the last two days.  This coin shot up a rough 850% in the past two weeks; going from a low of .04-.38 in many places.  The coin has since pulled back and now hovers around the .18-.20 cents mark (or ~1350 SATS). 

Where does it go from here?

While I enjoy a good run just like all the other bulls.  The best thing for this coin is a bit of consolidation.  Preferably between the 1100-1350 SATS (.16-.20).  If we can build a solid base around this area (several days-weeks); I am very confident that we will go on to reach .50 and $1 within the next month or so. 

The chart above demonstrates 3 areas of support in my observation.  If the 1st fails, chances are we head down to the 2nd.  If that fails, the 3rd, etc. 

For now; the best thing to do is hold or HODL!  From my observations, that's how you succeed in the crypto space. 

DISCLAIMER:  Nothing on this site shall be constituted as investment advice.  Cryptocurrency is a highly, note, HIGHLY speculative market.  The returns are great but so are the risks!  As with investing; I never invest with money I can not afford to lose. 
1 Comment
Thots Western Australia link
11/14/2022 02:04:11 pm

Very ccreative post

Reply


Leave a Reply.

    Author

    Tina "ShortMeTina" Ley (pronounced Lee) holds a Bachelor of Arts in Forensic Psychology and a Master's of Science in Mental Health Counseling and has been a stock market participant for over 10 years.  Currently a Full-Time Trader and Blogger of all things financial.


      Crypto Newsletter
      *subscribe below for further analysis and news*

    Subscribe to Newsletter

    Archives

    March 2018
    February 2018
    January 2018

    Categories

    All

    RSS Feed


Services
​

Premium Trading Course
Blog
Swing Trading Watch List
Free Trading Course


About Us
​

About
Terms of Service
​
Privacy
​Partnership


Support
​

Contact
FAQ


Community

This website is for information and illustrative purposes only. It is not, and should not be regarded as investment advice or as a recommendation to buy, sell and/or hold any securities mentioned.  All investments carry risk, there are no guarantees. Investors should consult with their advisers with respect to their investments.  Please read our full disclaimer here. 

CFTC RULE 4.41 – HYPOTHETICAL OR SIMULATED PERFORMANCE RESULTS HAVE CERTAIN LIMITATIONS. UNLIKE AN ACTUAL PERFORMANCE RECORD, SIMULATED RESULTS DO NOT REPRESENT ACTUAL TRADING. ALSO, SINCE THE TRADES HAVE NOT BEEN EXECUTED, THE RESULTS MAY HAVE UNDER-OR-OVER COMPENSATED FOR THE IMPACT, IF ANY, OF CERTAIN MARKET FACTORS, SUCH AS LACK OF LIQUIDITY. SIMULATED TRADING PROGRAMS IN GENERAL ARE ALSO SUBJECT TO THE FACT THAT THEY ARE DESIGNED WITH THE BENEFIT OF HINDSIGHT. NO REPRESENTATION IS BEING MADE THAT ANY ACCOUNT WILL OR IS LIKELY TO ACHIEVE PROFIT OR LOSSES SIMILAR TO THOSE SHOWN.

© COPYRIGHT 2016-2022  Akira Media, LLC.   ​ALL RIGHTS RESERVED.
  • HOME
  • TRADING COURSE