Analysis are ONLY for quick trades and NOT long term investments. Always define risk, allocate accordingly and understand the game you're playing! (eg: a chart dated for today is intended to be played for tomorrow and possibly the following day). IF it should be played at all.
SIGN-UP NOW AND RECEIVE YOUR FIRST 30 DAYS FOR LESS THAN $4/PER DAY.
|
January 31, 2017
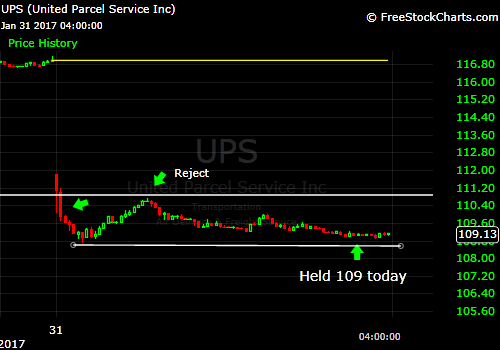
$UPS Currently short. Stock ranged between upper 111 to high 108s. 110 level rejected today. Held 109 a good deal of the day (battle ground level for me). Going into tomorrow and the remainder of the week; I would like to see it blow through 109. Stop Loss $112. Don't forget to sign-up for our free newsletter and follow me on ALL social media. |
February 1, 2017
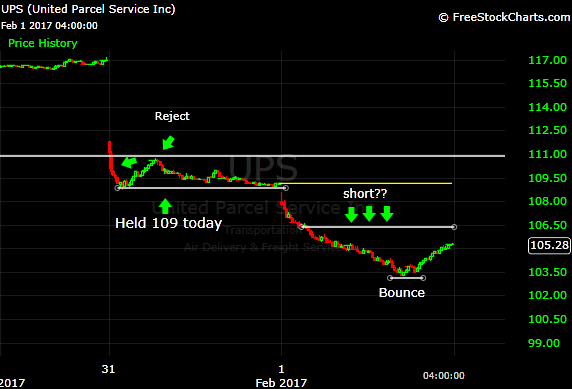
$UPS So looking at the short play from yesterday; we entered our position around 110; and saw 109 hold the majority of yesterday. We didn't have to wait all week; the stock opened below 109 and it was all down hill for UPS. Going as low as 103.23 today (+7 points overnight). After hitting the low of 103.23, the stock reversed and closed at 105.28. There's a possibility we have an up day tomorrow. I am looking at the 106/107 levels for an add. Let's see what tomorrow brings. Don't forget to sign-up for our free newsletter and follow me on ALL social media. |
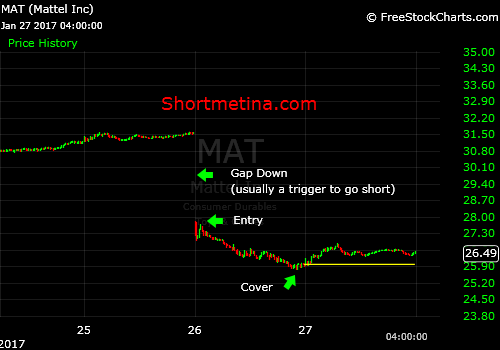
January 27, 2017
|
$MAT
This set up works. Well, it works atleast 50% of the time (arbitrary number but it works). The stock gaps down. Go short! Entry isn't super important as long as you follow the trend (going short w/ a gap down). If you're concerned with entry give the trade some time to show you an ideal entry. But again; you'll get a good % gain over the course of a few days/ weeks. Don't forget to sign-up for our free newsletter and follow me on ALL social media. |
January 25, 2017
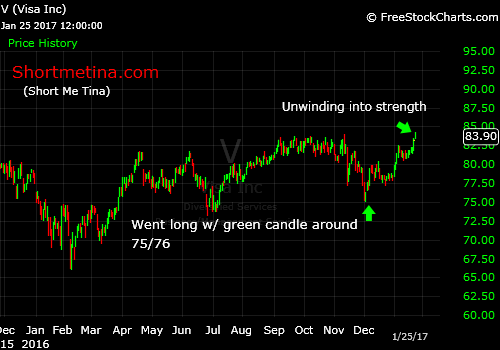
$V
Swinging Visa for several weeks now. Entered on the first green candle after the sell-off; using the previous day's low as my risk. The stock consolidated for a few days before making the next move towards the upside.
Easier to unwind (sell shares) into strength. +8 or so points.
Yes; ShortMeTina goes long.
Don't forget to sign-up for our free newsletter and follow me on ALL social media.
January 24, 2017
|
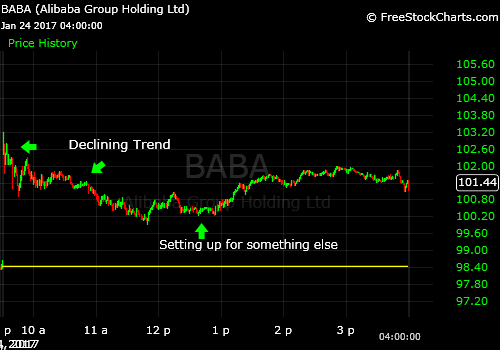
$BABA
I continue to speak about following the trend. Whether it is the intra-day trend, daily trend, monthly trend, etc. Unless a stock is basing or consolidating; there is a trend. I suggested life is easier when you trade in a manner consistent with the trend. That was done today in this BABA 'intra-day' trade. Early in the morning; I identified the trend was in a decline. I want to short stocks that are in a downtrend. Went short around $102 and covered in the low 101s, high 100s. Don't forget to sign-up for our free newsletter and follow me on ALL social media. |
January 19, 2017
|
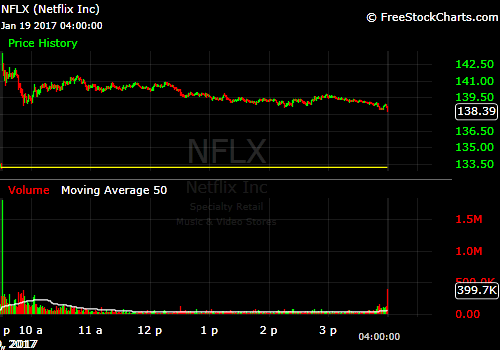
$NFLX
If we just look at trading action today; the trend sticks out like a sore thumb. Trading in any other direction but that of the trend is what? You guessed it; it's fighting the trend. Currently in this trade; will detail it when I am out but key levels I am paying attention to is 138-140. Mainly 139 ish. That seemed like a real battleground level today. Trade wisely. Don't forget to sign-up for our free newsletter and follow me on ALL social media. |
|
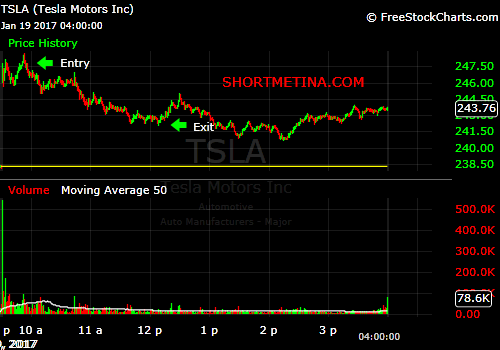
$TSLA
Went short when the stock had a hard time penetrating and staying above pre-market high of 248.66. Short avg around 247. Covered short around 242. +5 points. Looking for the gap of 238.68 to get filled at some point. We came close today with a low of 240.75 before we got that bounce. 245 is a key level for me tomorrow. No current positions. I have every intentions on taking a position providing an opportunity presents itself. Don't forget to sign-up for our free newsletter and follow me on ALL social media. |