Hot Stock Picks (Technical Analysis)
Stocks analyzed here are ONLY for quick swing trades and NOT long term investments. Always define risk, allocate accordingly and understand the game you're playing! (eg: a chart dated for today is intended to be played for tomorrow and possibly the following day). IF it should be played at all. Please ensure to read our disclaimer and take some time to get to know my style of trading before following. I am NOT a day trader; most stocks discussed here are for swing trades; however, at times the stock does what it needs to do in a day!
April 7, 2017
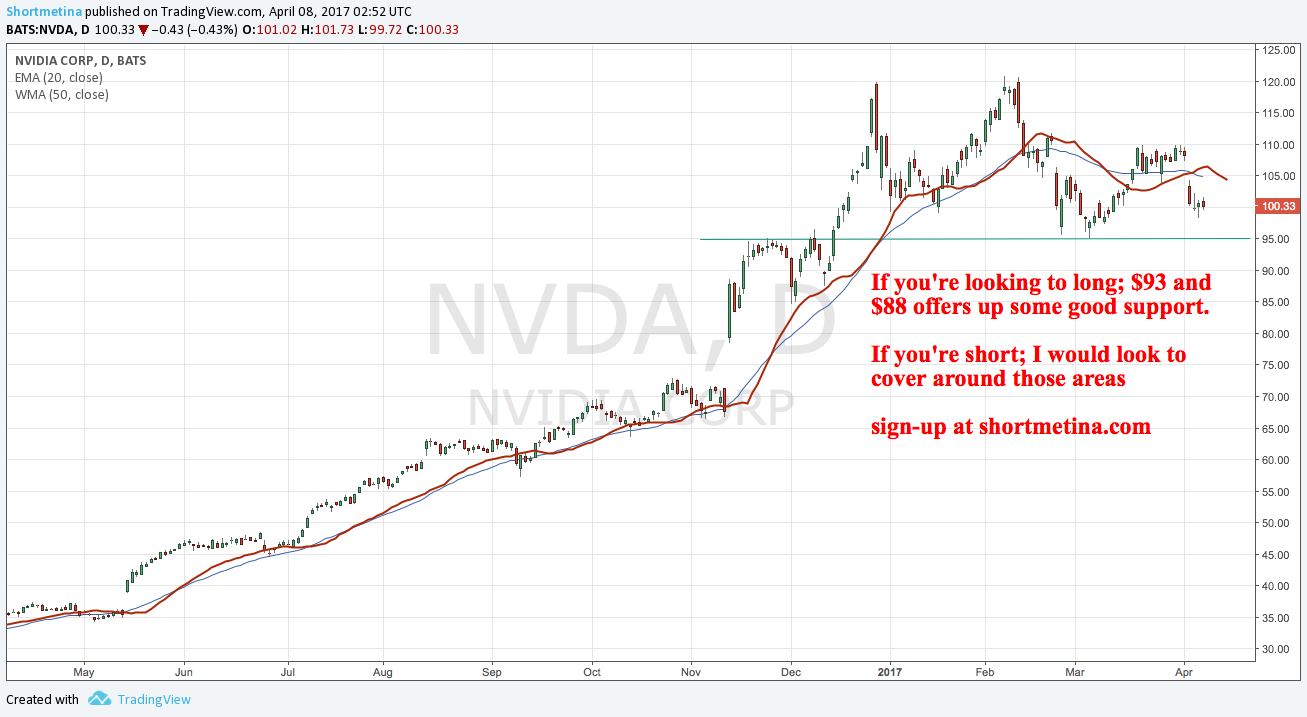
NVIDIA Corporation (NVDA)
Pure play on technicals. Stock has pulled back north of 20% since hitting a high of $120.92. I know it's never pleasant to see if you're on the long side but pullbacks are healthy. More often than not; the stock is re-energizing for another run. This can potentially be the case with Nvidia. Only time can truly tell.
If you're interested in jumping in cause you missed the first few runs; or if you want to see how much pain is in store; if you bought at the top; I might be able to help you out.
Solid support seems to be around $88 and $93. I would pay attention to those levels before taking a position.
If this straight forward analysis was helpful, hit the share button (on the left if you're seeing this on your laptop/desktop); or the share button on the bottom (if you're on your mobile phone).
Trade safely and remember to always do your HW! Oh and check out Zack and Bob's story here (hit the play button).
Become a part of the Short Me Tina Community! Sign-up for our 30 day trial to get real time alerts.
April 6, 2017
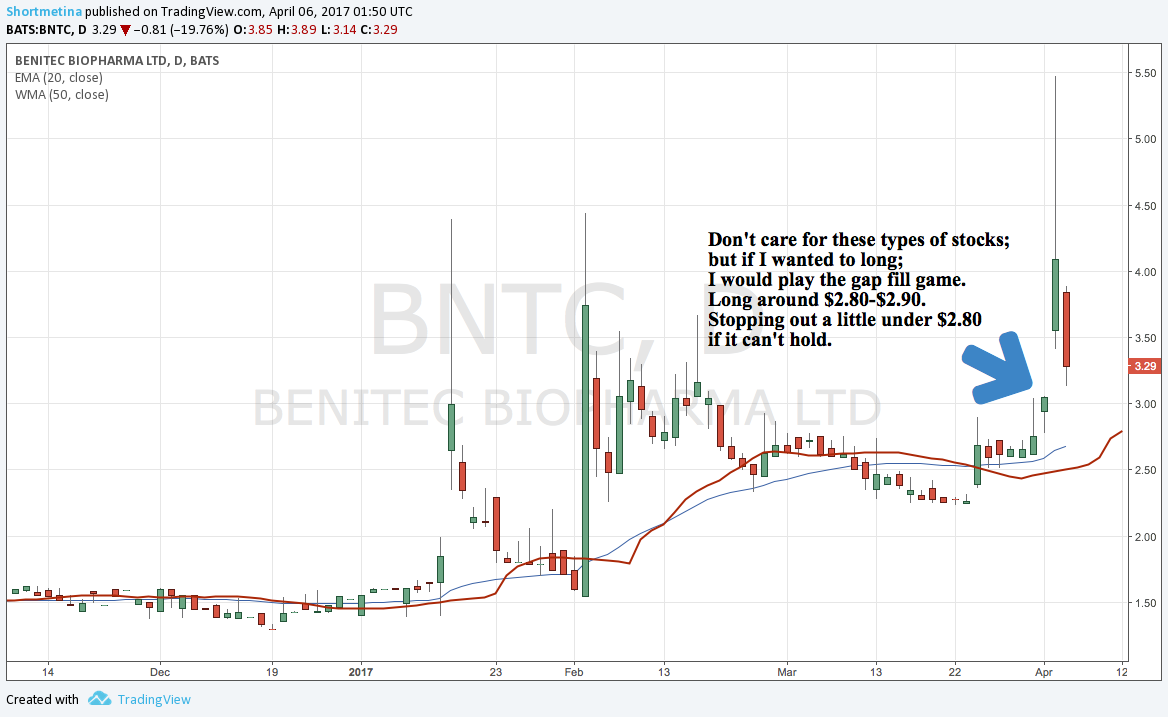
Benitec Biopharma Limited (BNTC)
Pure play on technicals. Not my kind of stock but if you're looking for a support zone. Based on the charts; I would say; it sits around $2.80-$2.90. Ensure to place a stop a few below $2.80 (or wherever you feel comfortable). If it can't rebound to $2.80 anytime soon; I think from a technical perspective the chart is broken. Note: this does not take into account any fundamentals.
Trade safely and remember to always do your HW!
Become a part of the Short Me Tina Community! Sign-up for our 30 day trial to get real time alerts.
April 6, 2017
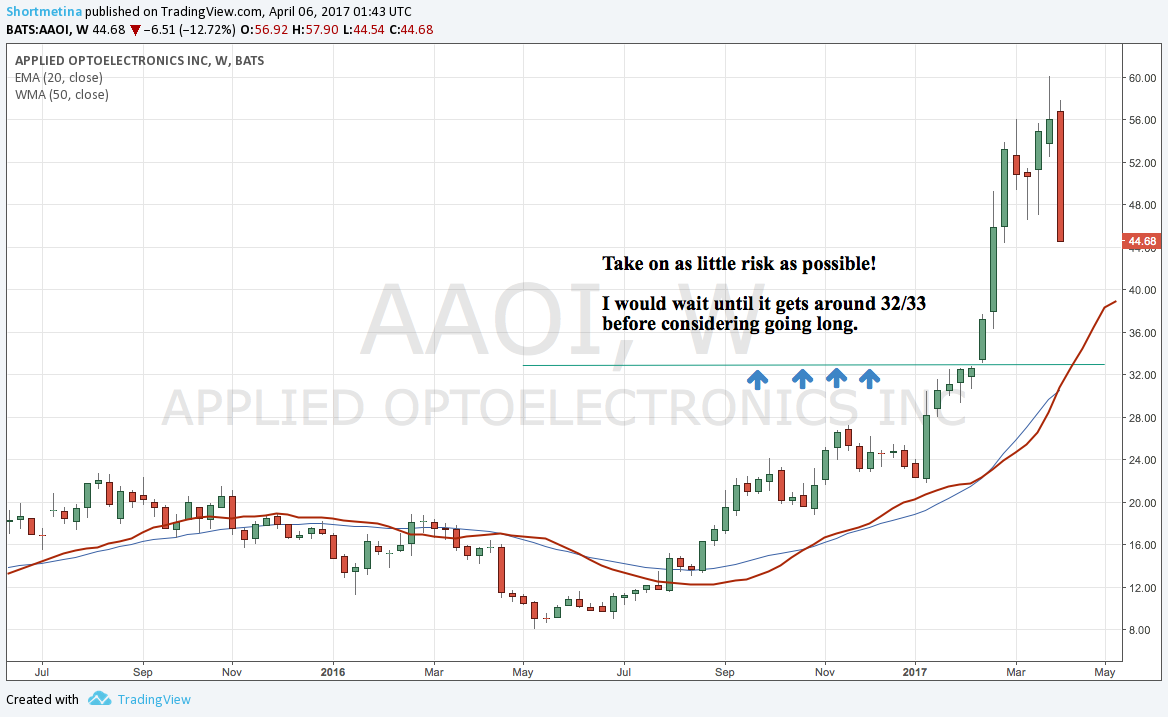
Applied Optoelectronics, Inc. (AAOI)
Pure play on technicals. If you're looking for a relatively safe 'long entry'; I would wait until the stock pulls back to 32/33 followed by a period of consolidation to confirm that it's basing. Stop-loss would be placed somewhere below that. If you're looking for a risk/reward formula check out ours here.
Trade safely and remember to always do your HW!
Become a part of the Short Me Tina Community! Sign-up for our 30 day trial to get real time alerts.