Hot Stock Picks (Technical Analysis)
Stocks analyzed here are ONLY for quick swing trades and NOT long term investments. Always define risk, allocate accordingly and understand the game you're playing! (eg: a chart dated for today is intended to be played for tomorrow and possibly the following day). IF it should be played at all. Please ensure to read our disclaimer and take some time to get to know my style of trading before following. I am NOT a day trader; most stocks discussed here are for swing trades; however, at times the stock does what it needs to do in a day!
SIGN-UP NOW AND RECEIVE YOUR FIRST 30 DAYS FOR LESS THAN $4/PER DAY.
March 16, 2017
$VRX (Valeant)
Follow-up video. Sometimes you have to give your trade more than a day to actually do what it's going to do.
Trade safely and remember to always do your HW before entering the stock market!
Follow-up video. Sometimes you have to give your trade more than a day to actually do what it's going to do.
Trade safely and remember to always do your HW before entering the stock market!
Become a part of the Short Me Tina Community! Sign-up for our 30 day trial to get real time alerts.
March 15, 2017
$GPRO (GoPro)
Stock is up 8% afterhours on reports that the company will issue a new round of lay-offs and other things. Video discusses possible outcomes for tomorrow. Have a listen.
I've set out on a goal to create one of the best trading communities out there; and it's materializing! Start today and become a member!
Trade safely and remember to always do your HW before trading the stock market!
Become a part of the Short Me Tina Community! Sign-up for our 30 day trial to get real time alerts.
March 14, 2017
$VRX (Valeant)
Activist investor Bill Ackman and Pershing Square finally decided to take the loss in VRX to the tune of 3 billion dollars!
I am not sure what made him decide to materialize the loss now but whatever it is; traders across the stock market reacted and the stock gapped down today; shedding about 10% in market cap. What's next for the stock? Find my video above with my thoughts.
I've set out on a goal to create one of the best trading communities out there; and it's materializing! Start today and become a member!
Trade safely and remember to always do your HW before trading!
Become a part of the Short Me Tina Community! Sign-up for our 30 day trial to get real time alerts.
March 9, 2017
$SNAP (Snapchat Inc.)
Yes, this is yet another Snapchat chart analysis. It's in the form of a YouTube video I posted yesterday, indicating how the stock should be traded today. Or rather; how the stock traded today (hint hint..I was correct). Take some time out to listen to the video. It's a little over 4 minutes long but after listening you will see why I tout myself as one of the BEST chart readers out there. This call makes #4, as in four separate (correct) calls on Snap chats trading action this week.
If you don't care to listen to the entire video (although I hope you do); fast forward to "2:20" where I indicated; the best place to go long was around "$22.50". Snapchat's low of today was "22.51". I call that nailing an entry. Fast forward to "3:30" where I said, the gap should be filled at $23.79. Granted we didn't get that high today but we went as high as $23.60! Considering the trading world isn't exact but an approximation; I would consider that exit call a winner as well.
I say all this to say; join my team. I've set out on a goal to create one of the best trading communities out there; and it's materializing! Start toda/start-trial.htmly and become a member!
Trade safely and remember to always do your HW before trading!
Become a part of the Short Me Tina Community! Sign-up for our 30 day trial to get real time alerts.
March 8, 2017
$SNAP (Snapchat Inc.)
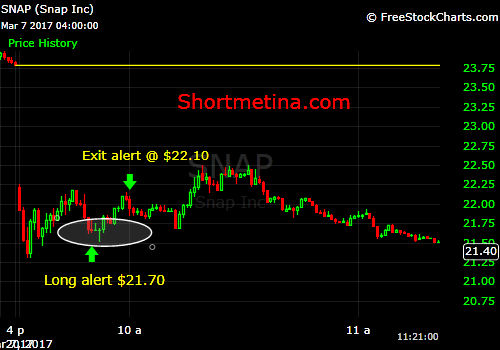
This has been a crazy stock!! Our trade today; however; just proves both long and shorts can make money in any given stock.
Trade break-down
The red candle with the wick (prior to side-ways action) signaled that the bulls were showing some strength. My buy alert came in at $21.70. Confirmation of that strength was followed by 3 "Dojis" on the minute chart and a long green candle.
The side-ways action typically signals a pause or breath. That is, the stock is taking a breather before it resumes a direction. Considering the bulls stepped in; I was fairly assured the walk up would begin around this time. It did and I alerted an exit around $22.10. Netting subscribers +.40 cents/per share on this trade.
It's a pattern that occurs time and time again. If you haven't read my article on "how to tell if the bear raid is over". Sign-up for free, Log-in and read it here. It walks you through some of the stuff I am talking about in this post. At any rate....
Trade safely and remember to always do your HW!
Become a part of the Short Me Tina Community! Sign-up for our 30 day trial to get real time alerts.
March 2, 2017
$SNAP
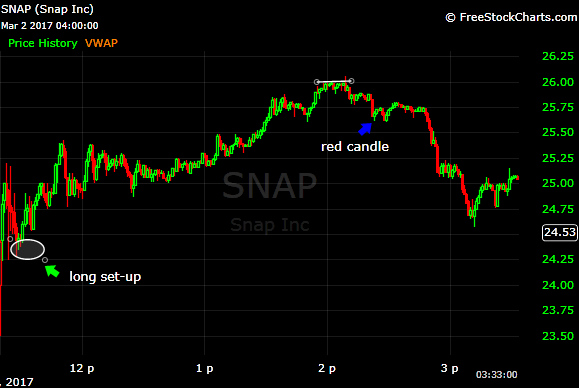
Pure play on technicals. Which wasn't necessarily the easiest today because there was no historical trading data to go by. But even so; I managed to see a trade, albeit a short term one. Saw the long play around $24.50 (and tweeted it out!) Buying the $23.50 dip would have been pure gamble to me; as no trend emerged (at that time) in my opinion. Saw the long red candle after the consolidating (illustrated by the blue arrow) and realized the stock was ready to dip. Hint: let go of your long position. A new trend started around 3pm-closing and it looks like another set-up is in play; however, can't call it until I see it tomorrow.
Trade safely and remember to always do your HW!
Become a part of the Short Me Tina Community! Sign-up for our 30 day trial to get real time alerts.